This appendix records the hardware and workloads behind the report’s quantitative results and defines their accounting conventions. Experiment records vary in which configurations, environment details, raw logs, profiles, and plotting sources were retained; the individual descriptions state that coverage. Credentials and secret environment variables are excluded.
B.1 Audited Hardware and Software
Table 45 records the allocation inspected on 2026-07-10, which hosted the profiling and kernel experiments; the production-throughput runs of Section 14 used larger allocations of the same node type (Appendix B.10). These are hardware and link properties, not measured collective bandwidth.
| Item | Audited value |
|---|---|
| Compute | Four homogeneous nodes; eight NVIDIA B300 SXM6 AC GPUs per node; 32 GPUs total |
| GPU memory | 275,040 MiB reported per GPU |
| Driver/toolkit | NVIDIA driver 590.48.01; driver CUDA compatibility 13.1; installed CUDA toolkit 13.0.88 |
| Intra-node fabric | Every GPU pair reported as NV18; 18 links per GPU at 53.125 GB/s per link |
| Inter-node fabric | Eight active nominal 800-Gb/s XDR InfiniBand rails per node, one PXB-local rail aligned with each GPU; additional 100-Gb/s HDR ports present |
| Shared storage | Olmo-core checkout on WekaFS, visible identically from all four nodes |
| Olmo-core | The DDP training stack of this report at the revision audited on 2026-07-10, with a clean working tree |
Software-environment fields identify the activated interpreter, PyTorch, NCCL, NVSHMEM, Transformer Engine/torchao, compiler, and extension versions where recorded. A non-login shell can select a different Python or omit the CUDA toolkit from PATH, so the machine inventory alone does not identify the software that executed a run. Network-interface and HCA selection likewise belongs to the realized launch environment rather than a machine-level default.
B.2 Audited Workload Roles
Table 46 describes a 30-block reference recipe and its reduced profiling counterpart, distinct from the headline run configurations in Section 14. The two exercise the same core BF16 rowwise path but are not interchangeable performance points.
| Role | Model and batch | Topology/precision | Experiment purpose |
|---|---|---|---|
| Profiling | 8 blocks, 32 routed experts, top-8, \(d=1536\), sequence 8192, 0.75-Mi-token global batch | EP-MP 8; 1–4 nodes; BF16 rowwise by default; no PP, CP, TP, TBO, or recompute | Host-visible route-shape profile; synchronized/rowwise/DeepEP topology comparison; initial multi-node scaling |
| 30-block reference | 30 blocks, 128 routed experts, top-8, \(d=1536\), sequence 8192, 18-Mi-token global batch | EP-MP 8; BF16 rowwise; no PP, CP, TP, TBO, or recompute in the base recipe | Full-reshard FSDP versus DDP-based training; production-scale throughput, efficiency, traffic, variance, and reliability |
B.3 The Main FSDP Comparison Uses Full Resharding
The main-text FSDP comparison uses the no-PP FSDP2 path with full resharding: each wrapped block all-gathers its full weights for forward, reshards them, all-gathers them again for backward, and reduce-scatters its gradients. This is the minimum-persistent-parameter-memory endpoint compared with Olmo’s DDP path, which keeps each rank’s assigned weights in device memory. FSDP2 can retain unsharded weights through backward or across intermediate accumulation backwards, but the latter policy makes peak parameter memory approach that of the DDP path with sharded optimizer state; it is therefore a mechanism ablation rather than a primary competing design in this report (Zhao et al. 2023; PyTorch Contributors 2026e).
Those retention policies lie between the two endpoints in parameter memory and communication; the main text analyzes only the full-reshard endpoint. FSDP and hybrid sharded data parallelism (HSDP) are also distinct configurations rather than interchangeable labels.
B.4 Reduced Profiling Changes the Workload
The 30-block reference recipe and its reduced profiling sibling exercise the same general BF16 rowwise path, but they are different sparse workloads. Based on configuration-derived counts, the reference recipe has \(\alpha_P=10.89\%\), a \(9.18\times\) capacity-to-active gap, and \(N/K=16\). Its 18-Mi-token optimizer step gives a balanced-routing mean of \(1.125\,\mathrm{Mi}\) assignments per routed expert. The profiling workload has \(\alpha_P=49.40\%\), a \(2.02\times\) gap, \(N/K=4\), and only \(0.1875\,\mathrm{Mi}\) balanced assignments per routed expert. A profiling result therefore cannot be presented as throughput for the 30-block reference.
| Quantity | 30-block reference | Profiling workload |
|---|---|---|
| Blocks and width | 30 blocks; first 2 dense, remaining 28 routed; \(d=1536\) | 8 blocks; first 2 dense, remaining 6 routed; same width and mixer family |
| Routed layer | \(N=128\), \(K=8\), routed intermediate width 1536, one shared expert | \(N=32\), \(K=8\), with the same expert widths and shared branch |
| Routing and capacity | Softmax top-\(K\), normalized route weights, capacity factor 1.25 | Same |
| Sequence and global batch | 8192 tokens; 18 Mi tokens per optimizer step | 8192 tokens; 0.75 Mi tokens per optimizer step |
| Configuration-derived size | 26.688B total, 2.906B active | 2.014B total, 0.995B active |
| Parallel/precision path | EP-MP 8; BF16 rowwise; no PP, CP, TP, TBO, or recompute | Same core path, with profiling callbacks and deliberately reduced model and batch |
The Introduction’s wall-time examples came from separate early comparisons in Megatron-LM and legacy Olmo-core. Their complete software and hardware environments have not been reconstructed. They therefore illustrate the observed slowdown that motivated this work, but do not provide a matched cross-framework benchmark.
For the profiling workload, the default rank microbatch is three sequences (24,576 tokens). The 0.75-Mi-token global batch yields four accumulation microbatches on one eight-GPU node and one on the 32-GPU pool. The profiling callbacks, reduced layers/experts, and smaller batch are profiling-specific; the BF16 rowwise routed-token path, EP-MP degree, lack of PP/CP/TP/TBO/recompute, and FP32 gradient and optimizer policy are shared with the 30-block reference.
B.5 Captured Submission-Regime Profiles
Section 8.1 describes two submission regimes: a host wait inside every routed block that holds the CPU and GPU in lock step, and a synchronization-free path in which the CPU runs ahead of the device. Figure 74 shows one captured Nsight Systems timeline for each regime, and Figure 75 magnifies their GPU kernel rows.
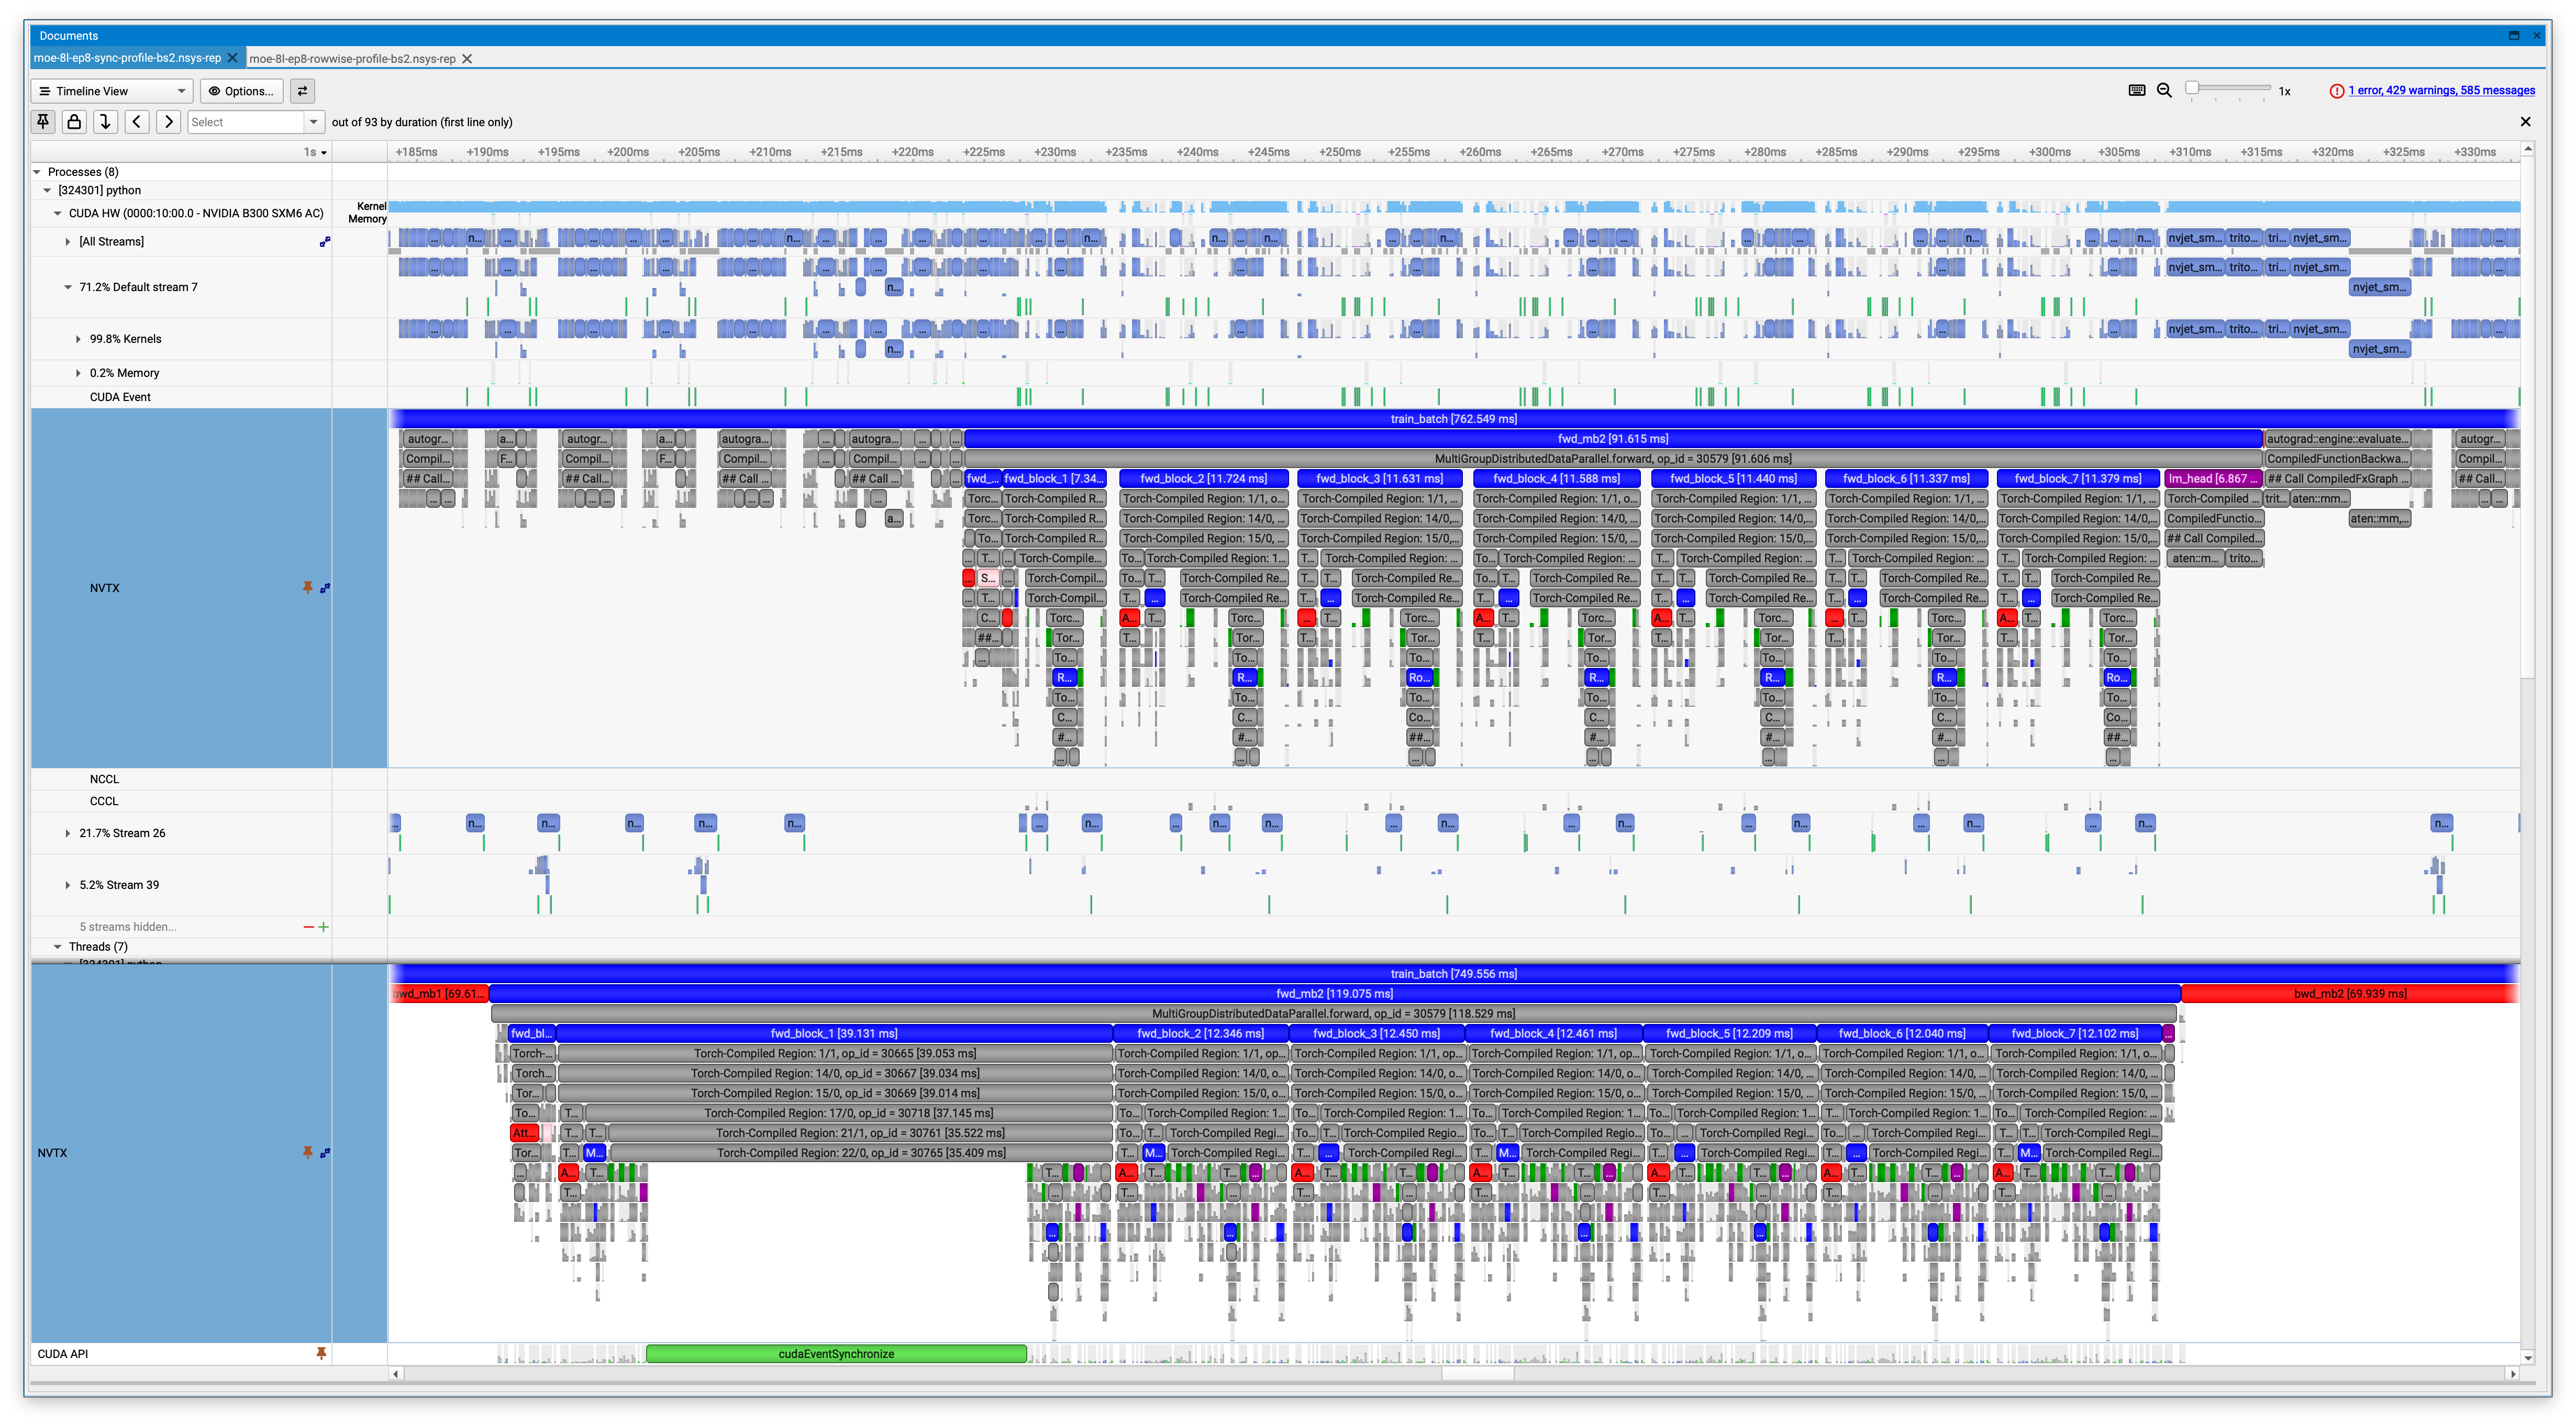
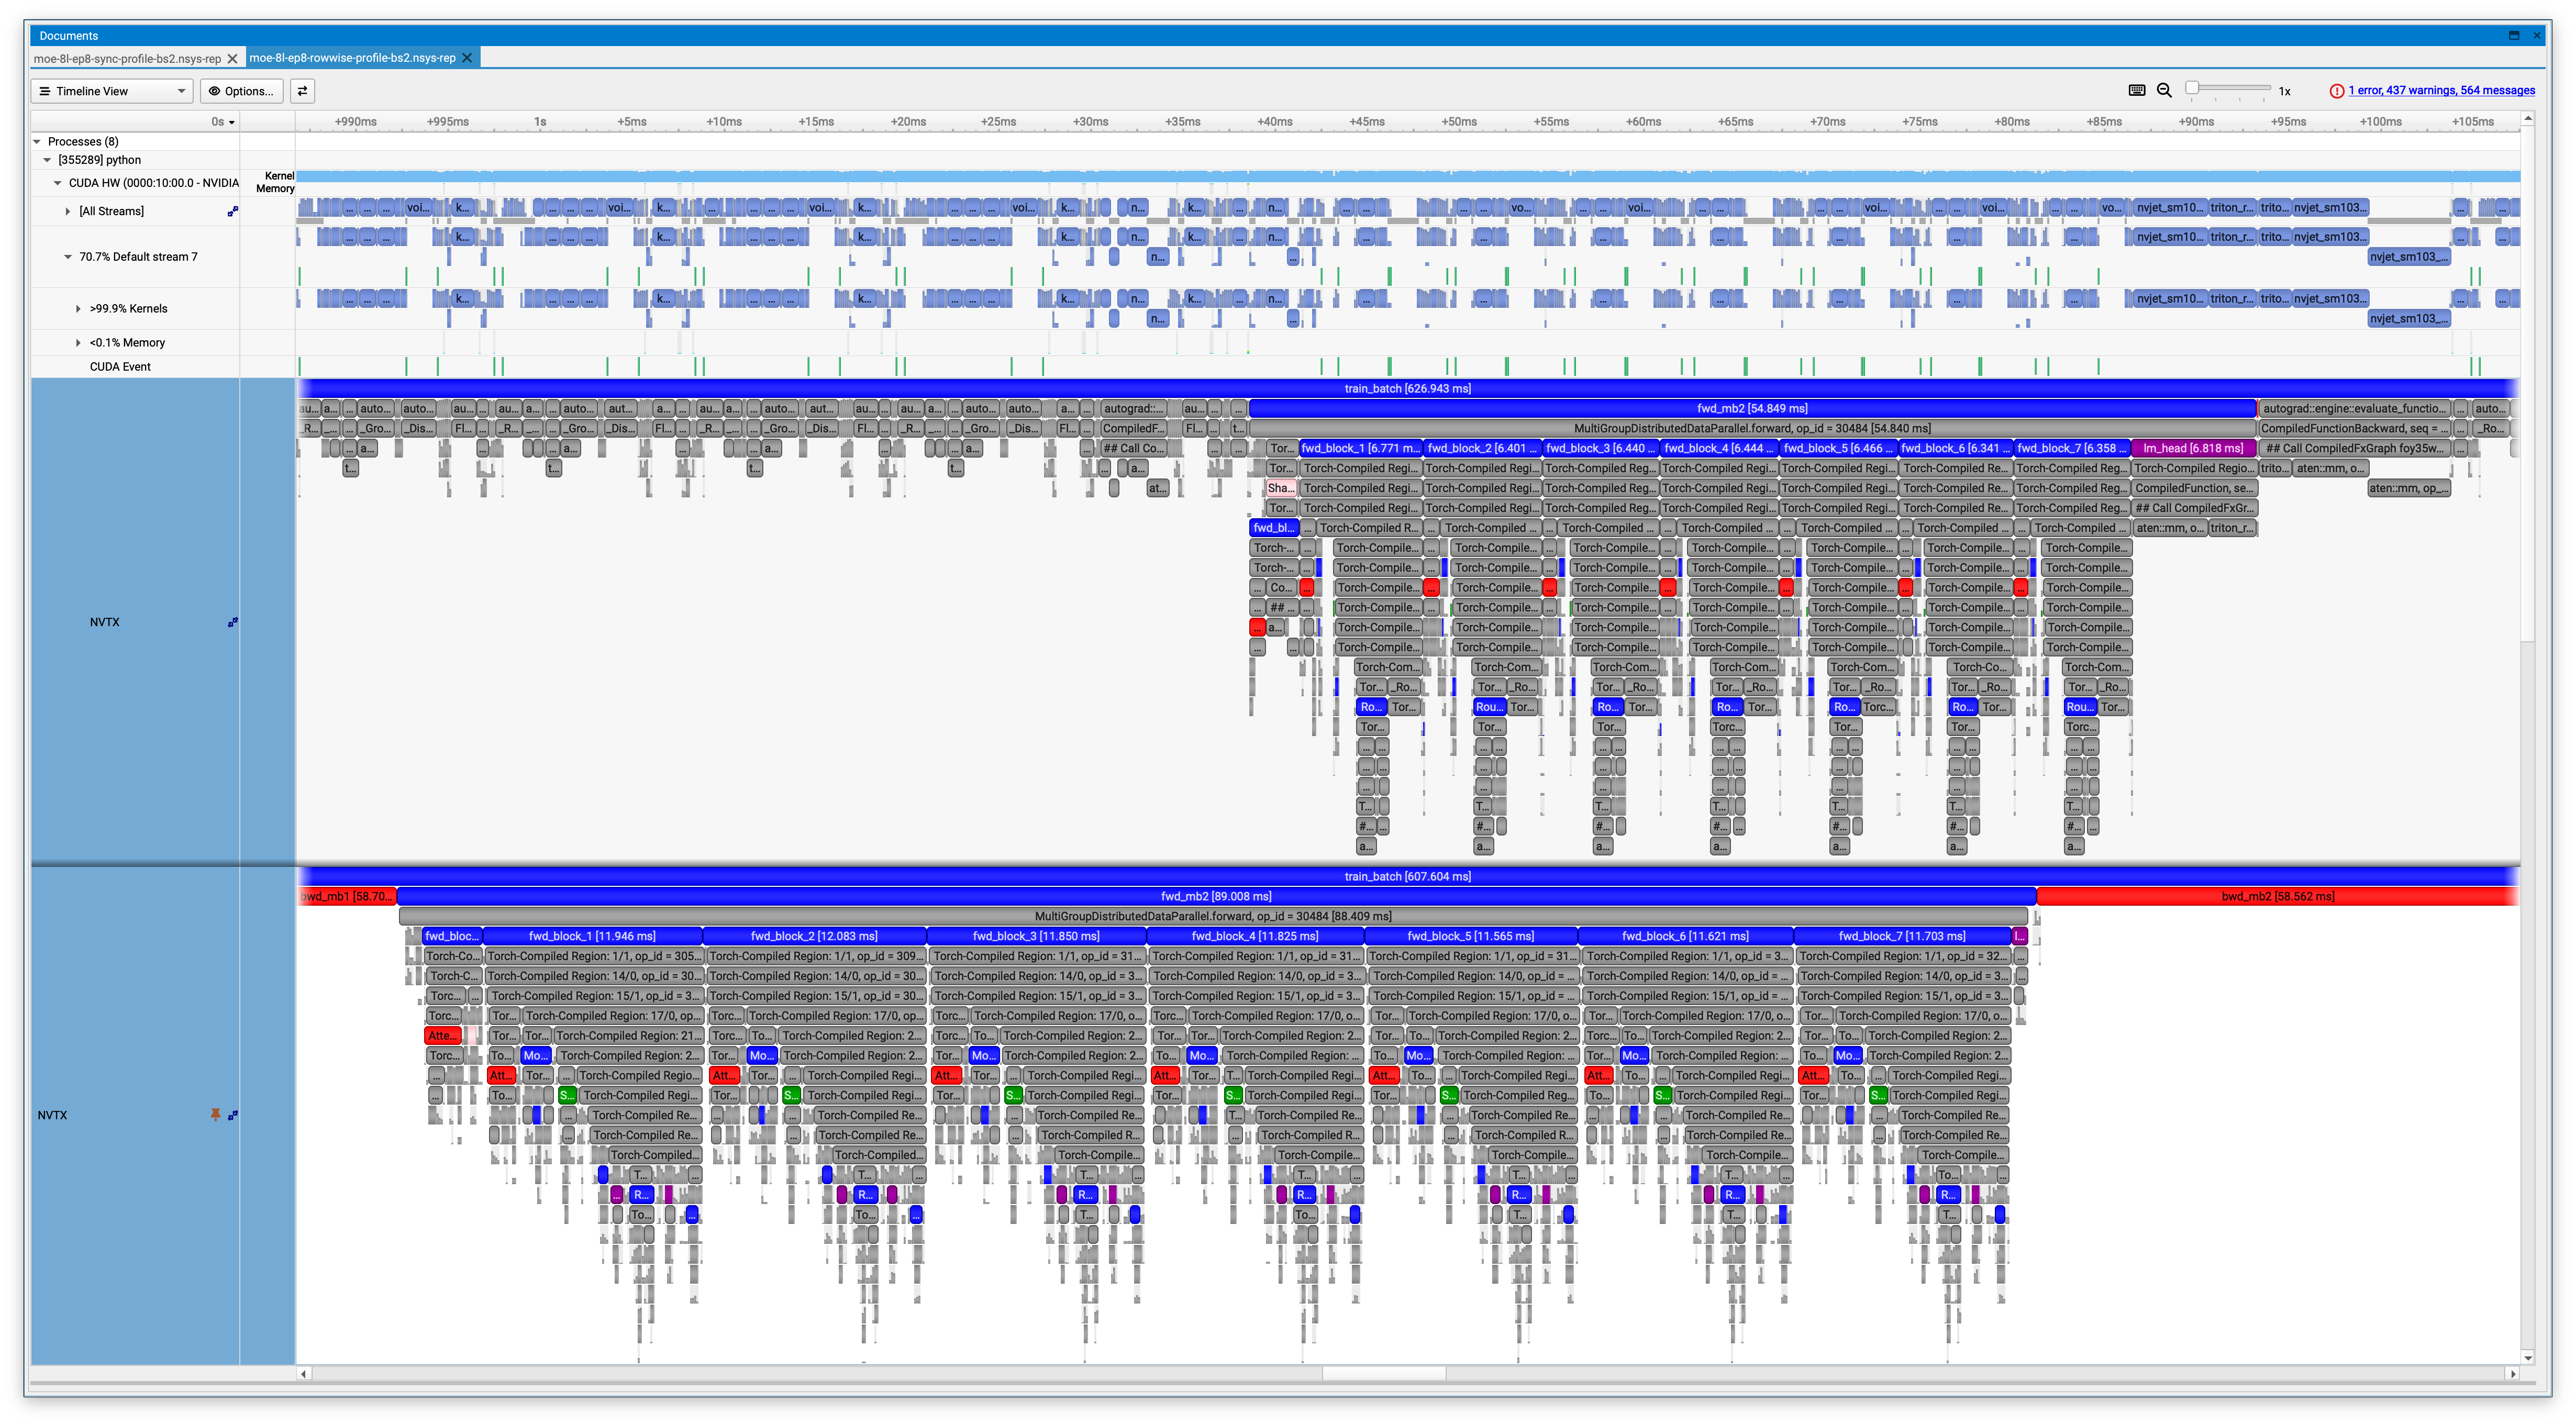
cudaEventSynchronize in the CUDA API lane, the CPU and GPU ranges of each forward block stay in lock step, and the GPU kernel rows show recurring gaps. In the rowwise trace (b), no host wait interrupts submission: the CPU finishes submitting the microbatch while the GPU is still executing earlier work, and the GPU-side forward blocks run back to back. Each panel is one captured instance of one rank; the two traces are separate runs, so this figure illustrates the submission mechanism rather than a controlled throughput comparison.

B.6 Verifying the Sync-Free Path
To check the sync-free property described in Section 8.5, we inspect the executed timeline. A qualifying steady-state trace contains no blocking D2H call and no submission-bound idle interval, which is what the captured pair in Figures 74 and 75 shows for the rowwise path. Step time alone cannot identify a submission problem. A useful profile reports CPU API and framework time, GPU kernel and communication time, the distance from CPU launch to GPU start, GPU idle intervals, blocking D2H calls, and end-to-end tokens/s, aligned at both the kernel level and larger NVTX ranges such as a transformer block or microbatch. PyTorch provides an experimental synchronization debug mode, but its coverage is incomplete for distributed and sparse operations; it is an audit aid rather than a substitute for a timeline (PyTorch Contributors 2026g).
A standalone single-GPU grouped-linear microbenchmark from the MXFP8 study (Section 11) isolates the submission tax that this checklist is meant to expose. Graph replay appears in this report only as a measuring instrument; the production training path never captures or replays a graph (Section 15.6). Table 48 compares ordinary eager submission with CUDA Graph replay for a locally adapted OLMoE-family benchmark (Muennighoff et al. 2024). Its \(1536\rightarrow3072\) up projection and 16 balanced local expert groups are settings of this single-B300 benchmark, not the published OLMoE configuration. “Prequantized” begins with MXFP8 input; “including Q” also charges the activation-quantization (Q) step. Every number is a speedup over the matching BF16 grouped GEMM.
| Prequantized input | Including Q | |||
| Rows \(M\) | Eager | Graph | Eager | Graph |
| 128 | 0.66× | 2.17× | 0.34× | 2.03× |
| 4,096 | 0.65× | 1.26× | 0.32× | 1.06× |
| 32,768 | 1.43× | 1.42× | 1.21× | 1.22× |
At \(M=128\), the captured device sequence is more than \(2\times\) faster than the BF16 baseline while ordinary eager execution is slower. At \(M=32{,}768\), the eager and graph results converge. The convergence indicates that host submission affects short-operator timings. The eager–graph gap is still not a clean measure of CPU launch time: replay changes the cache regime and excludes graph-launch latency, and the benchmark omits routing, communication, autograd, and the rest of the training step. The relevant end-to-end metric therefore remains eager training wall time.
Removing the split-list round trip is also only one side of the trade-off: direct row movement adds its own route construction, capacity storage, and completion costs. Several experiments examine different parts of that trade-off. The profiled example of Section 5.4 localizes the shorter dispatch-and-combine path, the captured timelines above show the two submission regimes, the microbenchmark isolates the submission tax on short expert operations, and the feasibility point of Table 6 shows one complete operating point without attributing its throughput to a single mechanism.
B.7 Checkpoint-Branched LBL-Coefficient Runs
Figures 45 and 46 derive from archived metric histories of two trajectories of the production pretraining project. The experiment package bundled with this report holds the run manifests with full effective configurations, the merged metric histories and their merge report, and the plotting script.
Model. 48 transformer blocks at \(d_{\mathrm{model}}=2048\); block 0 is dense, and each of the 47 MoE blocks uses 64 experts, top-4 selection, sigmoid gating, dropless dispatch, and expert intermediate width 2048; grouped-query attention (Ainslie et al. 2023) with 16 query and 4 key/value heads;
dolma2tokenizer (Allen Institute for AI 2024).Data and batch.
OLMo-mix-0625at sequence length 8,192; global batch 4,194,304 tokens per step.Objective. Instance-granularity LBL without per-layer rescaling; LM-head z-loss \(10^{-5}\); router z-loss disabled. The branched quantity is the LBL coefficient: \(0.05\) on the original trajectory and \(0.005\) on the branch.
Optimizer. Skip-step AdamW (Loshchilov and Hutter 2019) at learning rate \(3\times10^{-5}\) with betas \((0.9,0.95)\), weight decay \(0.1\) (zero on embeddings), a warmup–stable–decay schedule (Hu et al. 2024; Hägele et al. 2024) with a 2,000-step warmup, and gradient clipping at norm 1.
Execution. HSDP data parallelism with BF16 parameters; FP8 is disabled. These trajectories run the production pretraining stack rather than the expert-parallel paths of this report; the two branches differ only in the LBL coefficient, and no systems claim rests on them.
Branch protocol. The branch reloads the original run’s model and optimizer checkpoint at step 17,000 (71.3 billion tokens) and changes only the coefficient. The archive covers steps 1–25,669 of the original run and 17,001–81,084 of the branch. The Section 10 windows compare medians over steps 17,001–17,999 and 24,000–25,669, before the branch’s batch-size transition at step 40,000.
B.8 Batch-Size Warmup Run
This subsection records the training run behind Figure 66 in Section 16.
Model. 24 transformer blocks; 48 routed experts with top-4 selection and one shared expert; 3.21B active and 23.10B total parameters.
Batch schedule. The global batch increases through 1, 2, 3, 6, 9, 15, and 24 Mi tokens over approximately 2.07 trillion training tokens; the later transitions fall near 409B, 777B, and 1.375T cumulative tokens.
Learning rate. Square-root batch scaling (Equation 63 with \(\alpha=\tfrac{1}{2}\)) applied at each batch increase.
Optimizer. Skip-step AdamW with betas \((0.9,0.95)\) and weight decay \(0.1\), zero on embeddings, normalization weights, and the LM head; Muon is disabled.
Provenance. The figure stitches 26 run segments of one training campaign from its archived metric histories; at every overlapping step the newest segment’s value is retained. The artifact bundled with this report contains the raw exported metric histories, a per-segment run manifest, the stitched and plotted series, and the scripts that regenerate the figure from the archive alone.
Scope. The bundle preserves metric histories and figure provenance. The optimizer settings above come from the run’s training recipe as committed during the campaign; the serialized run configurations of the underlying segments are not re-audited here.
B.9 Experiment Artifact Contents
The following fields describe the configuration and evidence relevant to replicating a run. They define how this report describes its experiment records, not a claim that every archived artifact contains every field. Availability is stated with each experiment.
Provenance. Repository and dependency revisions, patch/diff, command, run name, and configuration after all overrides;
Model and workload. Total and active parameters, layers, mixers, experts, top-\(K\), shared experts, capacity/drop policy, sequence, local/global useful batch, and random seeds;
Topology. Nodes/GPUs and DP, CP, EP-DP, EP-MP, PP, VPP, microbatch, accumulation, and schedule;
Precision and layout. Parameter, activation, accumulation, reduction, optimizer, communication, cache, and checkpoint dtypes and layouts;
Environment. GPU clocks/power mode, driver/toolkit, activated software versions, NCCL/NVSHMEM interfaces and HCAs, compiler/cache controls, and relevant non-secret environment;
Measurement protocol. Data-prewarm, compile, symmetric-pool prewarm, warmup, measured steps, repetitions, synchronization points, exclusions, and failure/retry policy;
Raw outputs. Raw logs, rank-level metric tables, profiler captures, allocator traces, checkpoint metadata, and plotting scripts.
The effective serialized configuration, rather than the command string alone, determines the realized topology and workload after command-line overrides.
B.10 Production-Throughput Run Details
This subsection is the run-level companion to Table 30. All rows use sequence length 8192, top-4 routing, and one shared expert. The main table selects one random-routing systems reference per operating point; the tables below preserve the learned-routing companions and the alternate batches and topologies. A tracking-system status of “crashed” for these short systems runs can reflect manual termination after the desired observations and is not, by itself, evidence that training failed.
| Configuration | Model | Batch and scale | Parallel topology |
Numeric/runtime path |
|---|---|---|---|---|
| Tiny-64E, no EP | 16 layers; 64 routed experts; 1.59B active, 12.91B total | GBS 8 Mi; rank microbatch 65,536; 2 nodes, 16 B300s | 16 / 16 / 1 / 1 | BF16; no recompute; local expert execution |
| Tiny-64E, EP8 | Same model as Tiny-64E, no EP | GBS 8 Mi; rank microbatch 65,536; 2 nodes, 16 B300s | 16 / 2 / 8 / 1 | BF16; rowwise NVSHMEM; no recompute |
| Small-64E, 24 Mi | 32 layers; 64 routed experts; 4.29B active, 40.86B total | GBS 24 Mi; rank microbatch 24,576; 16 nodes, 128 B300s | 128 / 16 / 8 / 1 | BF16; rowwise NVSHMEM; no recompute |
| Small-64E, 16 Mi | Same Small-64E model | GBS 16 Mi; rank microbatch 16,384; 16 nodes, 128 B300s | 128 / 16 / 8 / 1 | BF16; rowwise NVSHMEM; no recompute |
| Medium-64E | 39 layers; 64 routed experts; 7.37B active, 70.22B total | GBS 16 Mi; rank microbatch 16,384; 16 nodes, 128 B300s | 64 / 8 / 8 / 2 | BF16; rowwise NVSHMEM; no recompute |
| Medium-96E | 39 layers; 96 routed experts; 7.38B active, 103.75B total | GBS 24 Mi; rank microbatch 16,384; 16 nodes, 128 B300s | 64 / 8 / 8 / 2 | BF16; rowwise NVSHMEM; no recompute |
| Medium-128E | 39 layers; 128 routed experts; 7.38B active, 137.27B total | GBS 24 Mi; rank microbatch 16,384; 16 nodes, 128 B300s | 32 / 4 / 8 / 4 | BF16; rowwise NVSHMEM; no recompute |
| Large-128E, PP4 | 47 layers; 128 routed experts; 15.14B active, 295.99B total | GBS 32 Mi; rank microbatch 8192; 64 nodes, 512 B300s | 128 / 16 / 8 / 4 | BF16; rowwise NVSHMEM; no recompute |
| Large-128E, PP8 | Same Large-128E model | GBS 24 Mi; rank microbatch 8192; 64 nodes, 512 B300s | 64 / 8 / 8 / 8 | BF16; rowwise NVSHMEM; no recompute |
| Ultra-128E | 63 layers; 128 routed experts; 58.36B active, 1.200T total | GBS 64 Mi; rank microbatch 8192; 64 nodes, 512 B300s | 64 / 8 / 8 / 8 | MXFP8 attention and MLP compute; rowwise NVSHMEM; per-layer recompute |
| Ultra-256E | 63 layers; 256 routed experts; 58.41B active, 2.380T total | GBS 64 Mi; rank microbatch 16,384; 64 nodes, 512 B300s | 64 / 2 / 32 / 8 | MXFP8 attention and MLP compute; DeepEP v2; per-layer recompute |
| Configuration | Routing | TFLOP/s /GPU |
Observation and use |
|---|---|---|---|
| Tiny-64E, no EP | Learned | 895 | Began near 870 and stabilized after roughly 100 steps; learned-routing companion |
| Tiny-64E, no EP | Random | 903 | Headline; random-routing curve was nearly stable from the first step |
| Tiny-64E, EP8 | Learned | 820 | Began near 799, then stabilized; learned-routing EP8 run with no random-routing pair |
| Small-64E, 24 Mi | Learned | 768 | Learned-routing companion |
| Small-64E, 24 Mi | Random | 841 | Headline |
| Small-64E, 16 Mi | Random | 821 | Alternate smaller GBS and rank microbatch; not a repeat of the 24-Mi run |
| Medium-64E | Random | 853 | Headline |
| Medium-96E | Random | 855 | Headline |
| Medium-96E | Random | 781 | Repeat with identical resolved configuration; not selected |
| Medium-96E | Random | 740 | Repeat with identical resolved configuration; not selected |
| Medium-128E | Random | 843 | Headline |
| Medium-128E | Random | 792 | Repeat with identical resolved configuration; not selected |
| Large-128E, PP4 | Random | 768 | Headline |
| Large-128E, PP8 | Random | 757 | Alternate PP8 and 24-Mi GBS; not a repeat of the headline run |
| Ultra-128E | Random | 858 | Headline |
| Ultra-256E | Random | 689 | Headline short-run observation; nine steps and no stabilized plateau |
Slower repeat launches of the Medium-96E and Medium-128E configurations appear in Table 50 but are omitted from the headline selection. Environmental problems were suspected, but the specific cause was not established. The headline table reports the highest rate observed for each configuration, which is neither a repetition mean nor an estimate of the hardware limit.
B.11 Metrics Track Useful Work, Time, and Memory
Table 51 defines the quantities used to compare useful work, time, and memory. Each experiment specifies which metrics and supplemental diagnostics were retained; a definition here does not imply that the quantity was measured in every run.
| Metric | Definition |
|---|---|
| Steady-state step time | Wall time from the start of an optimizer step’s first forward to completion of optimizer update and required cache refresh, after declared startup/warmup. Depending on the retained samples, summaries may include median, mean, standard deviation, and tails |
| Useful tokens/s/GPU | Global non-padding tokens contributing to the normalized loss per measured step, divided by synchronized step time and GPU count; capacity-dropped routes are a separate quantity rather than silently removed |
| Useful-model MFU | Useful active-model FLOPs divided by elapsed time, GPU count, and the stated per-GPU compute peak. Sections 2 and 14 use the B300 dense BF16 peak of 2250 TFLOP/s/GPU for every row, including MXFP8, and label this common BF16-reference normalization explicitly. It is not utilization of the FP8 peak. Recompute and inactive experts add no useful FLOPs to the numerator |
| D2H route-shape wall time | Count and duration of host waits/copies causally between router metadata production and dependent dispatch/compute launches, plus the corresponding CPU launch gap and GPU idle interval from the same timeline |
| Communication exposure | Dispatch/combine or weight/gradient communication time not hidden by useful compute, with bytes, primitive, process group, and forward/backward scope identified |
| Route/drop statistics | Offered and accepted assignments, total and per-source drop rate, per-expert load distribution, capacity utilization, and rank skew |
| Peak device memory | Maximum allocated and reserved bytes per rank after a declared reset point. Supplemental diagnostics, where recorded, give max/median ranks and whether compiler/graph memory pools, symmetric pools, derived caches, and checkpoint staging were allocated at reset and remained allocated through the measured window |
| Lease high-water | Maximum concurrently checked-out saved-payload slots by block/payload/pipeline part. A schedule-derived prediction and transient shared scratch usage are separate diagnostics where available |
| Checkpoint peak/time | Pre-save and peak allocated/reserved bytes, and elapsed save or load time. Supplemental diagnostics include bytes written/read, retries, and caches allocated at the measurement boundary, where recorded |
| Scaling efficiency | Measured useful throughput relative to the declared one-node or smallest valid topology reference under a stated strong/weak-scaling batch rule; rank variance is a supplemental diagnostic where recorded |
For an optimizer step with \(F_{\mathrm{step}}\) useful model FLOPs, elapsed time \(T_{\mathrm{step}}\) in seconds, and \(G\) GPUs, the report uses \[ \mathrm{MFU}_{\mathrm{BF16\mbox{-}ref}} = \frac{F_{\mathrm{step}}} {G\,T_{\mathrm{step}}\,C_{\mathrm{BF16}}}, \qquad C_{\mathrm{BF16}}=2.25\times10^{15}\ \mathrm{FLOP/s} \quad\text{per B300 GPU}. \tag{95} \] This is the dense BF16 Tensor Core peak, not NVIDIA’s doubled 2:4-sparse peak (NVIDIA 2026q); selecting a subset of experts does not make their weight matrices 2:4 sparse. The numerator counts active-model work, excluding activation recomputation, while elapsed time includes the complete step. We retain this BF16 reference for MXFP8 runs so the normalization is consistent; those values are not utilization of the FP8 peak.