
Each routed expert sees only a fraction of the global tokens. This motivates a simple heuristic: if \(K\) of \(N\) experts are selected for each token, reduce the expert learning rate by the square root of the expert activation ratio \(\alpha_E=K/N\),
\[ \eta_{\mathrm{expert}} = \eta_{\mathrm{main}}\sqrt{K/N}. \tag{73} \]
We are not aware of an established expert-learning-rate rule of this form; we tested it as a direct analogy to the square-root batch-size rule of Section 16. For top-\(4\) routing over 64 experts, this sets the expert learning rate to one quarter of the main learning rate. This analogy assumes that expert-gradient noise follows the same scaling as an ordinary independently sampled batch. Routed tokens, router specialization, Adam preconditioning, and correlations between experts need not satisfy that assumption. OLMoE’s routing analyses, for example, find domain and vocabulary specialization rather than identical random subsamples across experts (Muennighoff et al. 2024).
We tested the heuristic with \(0.43\text{B}@2.51\text{B}\) (active@total parameters) MoEs using 64 routed experts and top-\(4\) routing. Each point trains one model to 150B tokens with AdamW (\(\beta_1=0.9\), \(\beta_2=0.95\)). One sweep uses the same learning rate for all parameters; the other applies Equation 73 to the routed-expert parameters while sweeping the main learning rate. The unscaled sweep reached a lower best validation loss than the sparsity-scaled sweep, even after the main learning rate was retuned for each: the smaller expert learning rate did not improve this controlled model family.
Figure 67Interactive · measured, 18 single runs · no seed replication
Read both sweeps at every main learning rate
Chart of measured C4 validation loss against main learning rate for both sweeps, 18 runs, on the report’s full loss range, 2.83 to 3.26. Teal circles: one learning rate for all parameters. Orange squares: expert learning rate set to one quarter of the main learning rate (the square root of K/N). Rings mark the best run of each sweep. Lower strip: scaled minus unscaled loss at each main learning rate. Use the arrow keys, Home and End to move between the nine main learning rates; Escape returns to the best run of each sweep.
Best run of each sweep
One learning rate
2.87329main LR 8 × 10⁻⁴
Scaled expert LR
2.87822main LR 2 × 10⁻³; experts 5 × 10⁻⁴
Best scaled − best unscaled+0.005single runs: a directional comparison
Point at or tap the chart, use its arrow keys, or choose a rate below to read both runs at one main learning rate.
Main learning rate
2 × 10⁻⁵
One learning rate
3.07879experts 2 × 10⁻⁵
Scaled expert LR
3.24294experts 5 × 10⁻⁶
Scaled − unscaled+0.164lower loss with one learning rate
Main learning rate
2 × 10⁻⁴
One learning rate
2.89564experts 2 × 10⁻⁴
Scaled expert LR
2.93226experts 5 × 10⁻⁵
Scaled − unscaled+0.037lower loss with one learning rate
Main learning rate
8 × 10⁻⁴
One learning ratebest of this sweep
2.87329experts 8 × 10⁻⁴
Scaled expert LR
2.8883experts 2 × 10⁻⁴
Scaled − unscaled+0.015lower loss with one learning rate
Main learning rate
1 × 10⁻³
One learning rate
2.87369experts 1 × 10⁻³
Scaled expert LR
2.88387experts 2.5 × 10⁻⁴
Scaled − unscaled+0.010lower loss with one learning rate
Main learning rate
1.6 × 10⁻³
One learning rate
2.87952experts 1.6 × 10⁻³
Scaled expert LR
2.88095experts 4 × 10⁻⁴
Scaled − unscaled+0.001lower loss with one learning rate
Main learning rate
2 × 10⁻³
One learning rate
2.88608experts 2 × 10⁻³
Scaled expert LRbest of this sweep
2.87822experts 5 × 10⁻⁴
Scaled − unscaled−0.008lower loss with the scaled expert LR
Main learning rate
4 × 10⁻³
One learning rate
2.91137experts 4 × 10⁻³
Scaled expert LR
2.88938experts 1 × 10⁻³
Scaled − unscaled−0.022lower loss with the scaled expert LR
Main learning rate
8 × 10⁻³
One learning rate
2.94859experts 8 × 10⁻³
Scaled expert LR
2.9092experts 2 × 10⁻³
Scaled − unscaled−0.039lower loss with the scaled expert LR
Main learning rate
1.6 × 10⁻²
One learning rate
3.00046experts 1.6 × 10⁻²
Scaled expert LR
2.94402experts 4 × 10⁻³
Scaled − unscaled−0.056lower loss with the scaled expert LR
Choose a main learning rate
All 18 runsthe values of Figure 67, as recorded in the report’s data file
0.43B@2.51B MoEs with top-4 of 64 routed experts, 150B tokens per run, C4 validation loss. Plotted from the report’s data file for this figure, the same 18 runs as the original, copied without rounding; chart labels round to three decimals. Markers are runs and connecting lines are visual guides, as in the report. The lower strip subtracts the two losses at the same main learning rate; the report’s comparison is between the best run of each sweep.
Original report figure
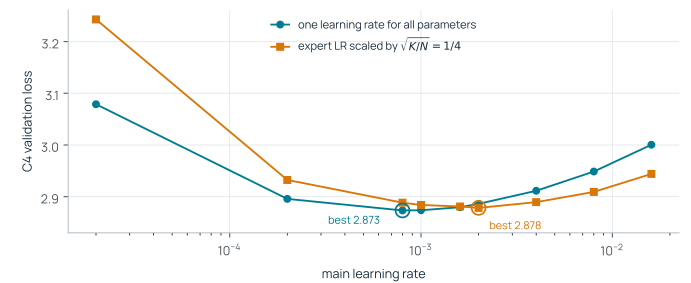
In these sweeps, the expert activation ratio alone did not justify square-root down-scaling. Our default is therefore to use the same learning rate for routed experts and the rest of the model unless a matched sweep for the target model supports a different choice.